Six visual guides to Springfield
Explore The Simpsons infographics through the people, places and patterns that make Springfield recognizable. Meet the actors behind familiar character voices, follow Homer Simpson’s improbable career, revisit the show’s history, and compare visual guides to episodes, audience figures and the family’s travels.
This collection brings together six illustrated resources, from a Simpsons voice cast chart to Homer’s résumé and a map of countries visited in the series. Each preview opens the original full-size infographic, while the accompanying article provides more context. Choose a subject below, or work through the collection to see how character design, performance and storytelling connect.
The collection spans different eras of the show, including a 1987 to 2017 anniversary retrospective and an episode chart covering Seasons 1 to 25. Dates and sample sizes appear with the relevant graphics.
The Simpsons voice actors: the cast behind the character voices
One of the pleasures of a Simpsons cast infographic is discovering how many familiar voices connect to the same performer. A character’s appearance makes that person easy to recognize on screen; a voice actor chart reveals a different set of connections, grouping Springfield residents by the performers behind them.
This illustrated guide introduces six central members of The Simpsons voice cast: Dan Castellaneta, Julie Kavner, Nancy Cartwright, Yeardley Smith, Hank Azaria and Harry Shearer. It is a starting point for exploring the ensemble, rather than a complete directory of every supporting performer, guest star or actor who has worked on the series.

| Voice actor | Familiar character voices |
|---|---|
| Dan Castellaneta | Homer Simpson |
| Julie Kavner | Marge Simpson |
| Nancy Cartwright | Bart Simpson |
| Yeardley Smith | Lisa Simpson |
| Hank Azaria | Moe and Chief Wiggum |
| Harry Shearer | Mr. Burns, Smithers and Kent Brockman |
Read the cast chart by following each performer’s group of portraits. The family voices provide an easy entry point, while the supporting characters show the range of personalities an actor can create. The useful distinction is between who a character is and who performs the voice: a large animated cast does not require a different actor for every resident of Springfield.
For more actor profiles and character connections, continue to the illustrated guide to The Simpsons cast and voices. Following the portrait groups is part of the fun: characters with very different personalities can share a performer.
Homer Simpson’s jobs: a résumé of unlikely career moves
Homer Simpson’s regular job at Springfield’s nuclear power plant is the anchor of his working life. His wider employment history is much less predictable. Temporary positions, side businesses and improbable opportunities turn a fictional career into a visual catalogue of the show’s changing situations.
The Homer Simpson jobs infographic presents that career as a résumé. Nuclear safety inspector, astronaut, boxer and snowplow operator are a few of the roles that make his employment history so varied. Occupations sit alongside one another, making the distance between routine plant work and an extraordinary one-off adventure immediately visible. It is a playful way to explore Homer’s work history without treating the document as a literal, internally consistent employment record.

Homer’s career history, salary and paycheck
A useful way to compare Homer Simpson’s jobs is to separate his recurring occupation from short-lived roles and independent ventures. The same distinction matters when asking how many jobs Homer has had: a count can change depending on whether it includes a brief assignment, a side business, an imagined sequence or a role mentioned only in dialogue.
Questions about Homer Simpson’s salary need similar care. An on-screen paycheck is a detail from a particular story, rather than proof that his income stays fixed throughout the series. His fictional earnings also answer a different question from the real-world pay of someone working in a nuclear facility.
The Homer Simpson résumé and jobs guide goes further into career examples, episode references and the paycheck discussion. Use this collection to choose the visual reference, then use the dedicated article when you want the fuller employment story.
The Simpsons history: facts, trivia and a 30-year visual retrospective
A show with a long history can be difficult to summarize in a single timeline. Character designs, memorable episodes, quotations and cultural references develop alongside one another. A Simpsons history infographic brings those strands into the same space, letting readers move between production milestones and the smaller details fans remember.
The anniversary graphic in this collection is explicitly framed around 1987 to 2017. The Simpsons began as shorts on The Tracey Ullman Show in 1987; the first full-length episode premiered on December 17, 1989. Those two starting points explain why a 30-year retrospective can begin before the television series’ first season. The graphic’s totals, rankings and milestones belong to its anniversary frame.

Start with the visual comparison between eras, then explore the episode references and quotations. “Homer’s Enemy” and “You Only Move Twice” appear in the graphic’s episode selections, giving familiar stories a place alongside the broader milestones. The juxtaposition is part of the appeal: the history of a television series is also the history of the particular scenes and characters its viewers remember.
The poster works as a prompt for a rewatch or a Simpsons trivia conversation. Compare character designs, revisit a quoted moment, or choose an episode from the illustrated retrospective. The Simpsons facts, history and legacy article is its companion guide; episode rankings remain those recorded for the original anniversary graphic.
Simpsons character statistics: who gets the story?
A character can be present in an episode without being its main subject. That distinction is central to 552 Days of Springfield, an infographic exploring the narrative patterns of Seasons 1 to 25. Its 552-episode sample is organized into 25 types, using a main character or recurring theme to classify each story.
For readers interested in Simpsons characters, the appeal is seeing the family and the wider town through the stories built around them. Homer-focused episodes occupy a different category from Bart-focused episodes, while recurring themes offer another way to organize a large television archive. The chart makes those editorial choices visible.
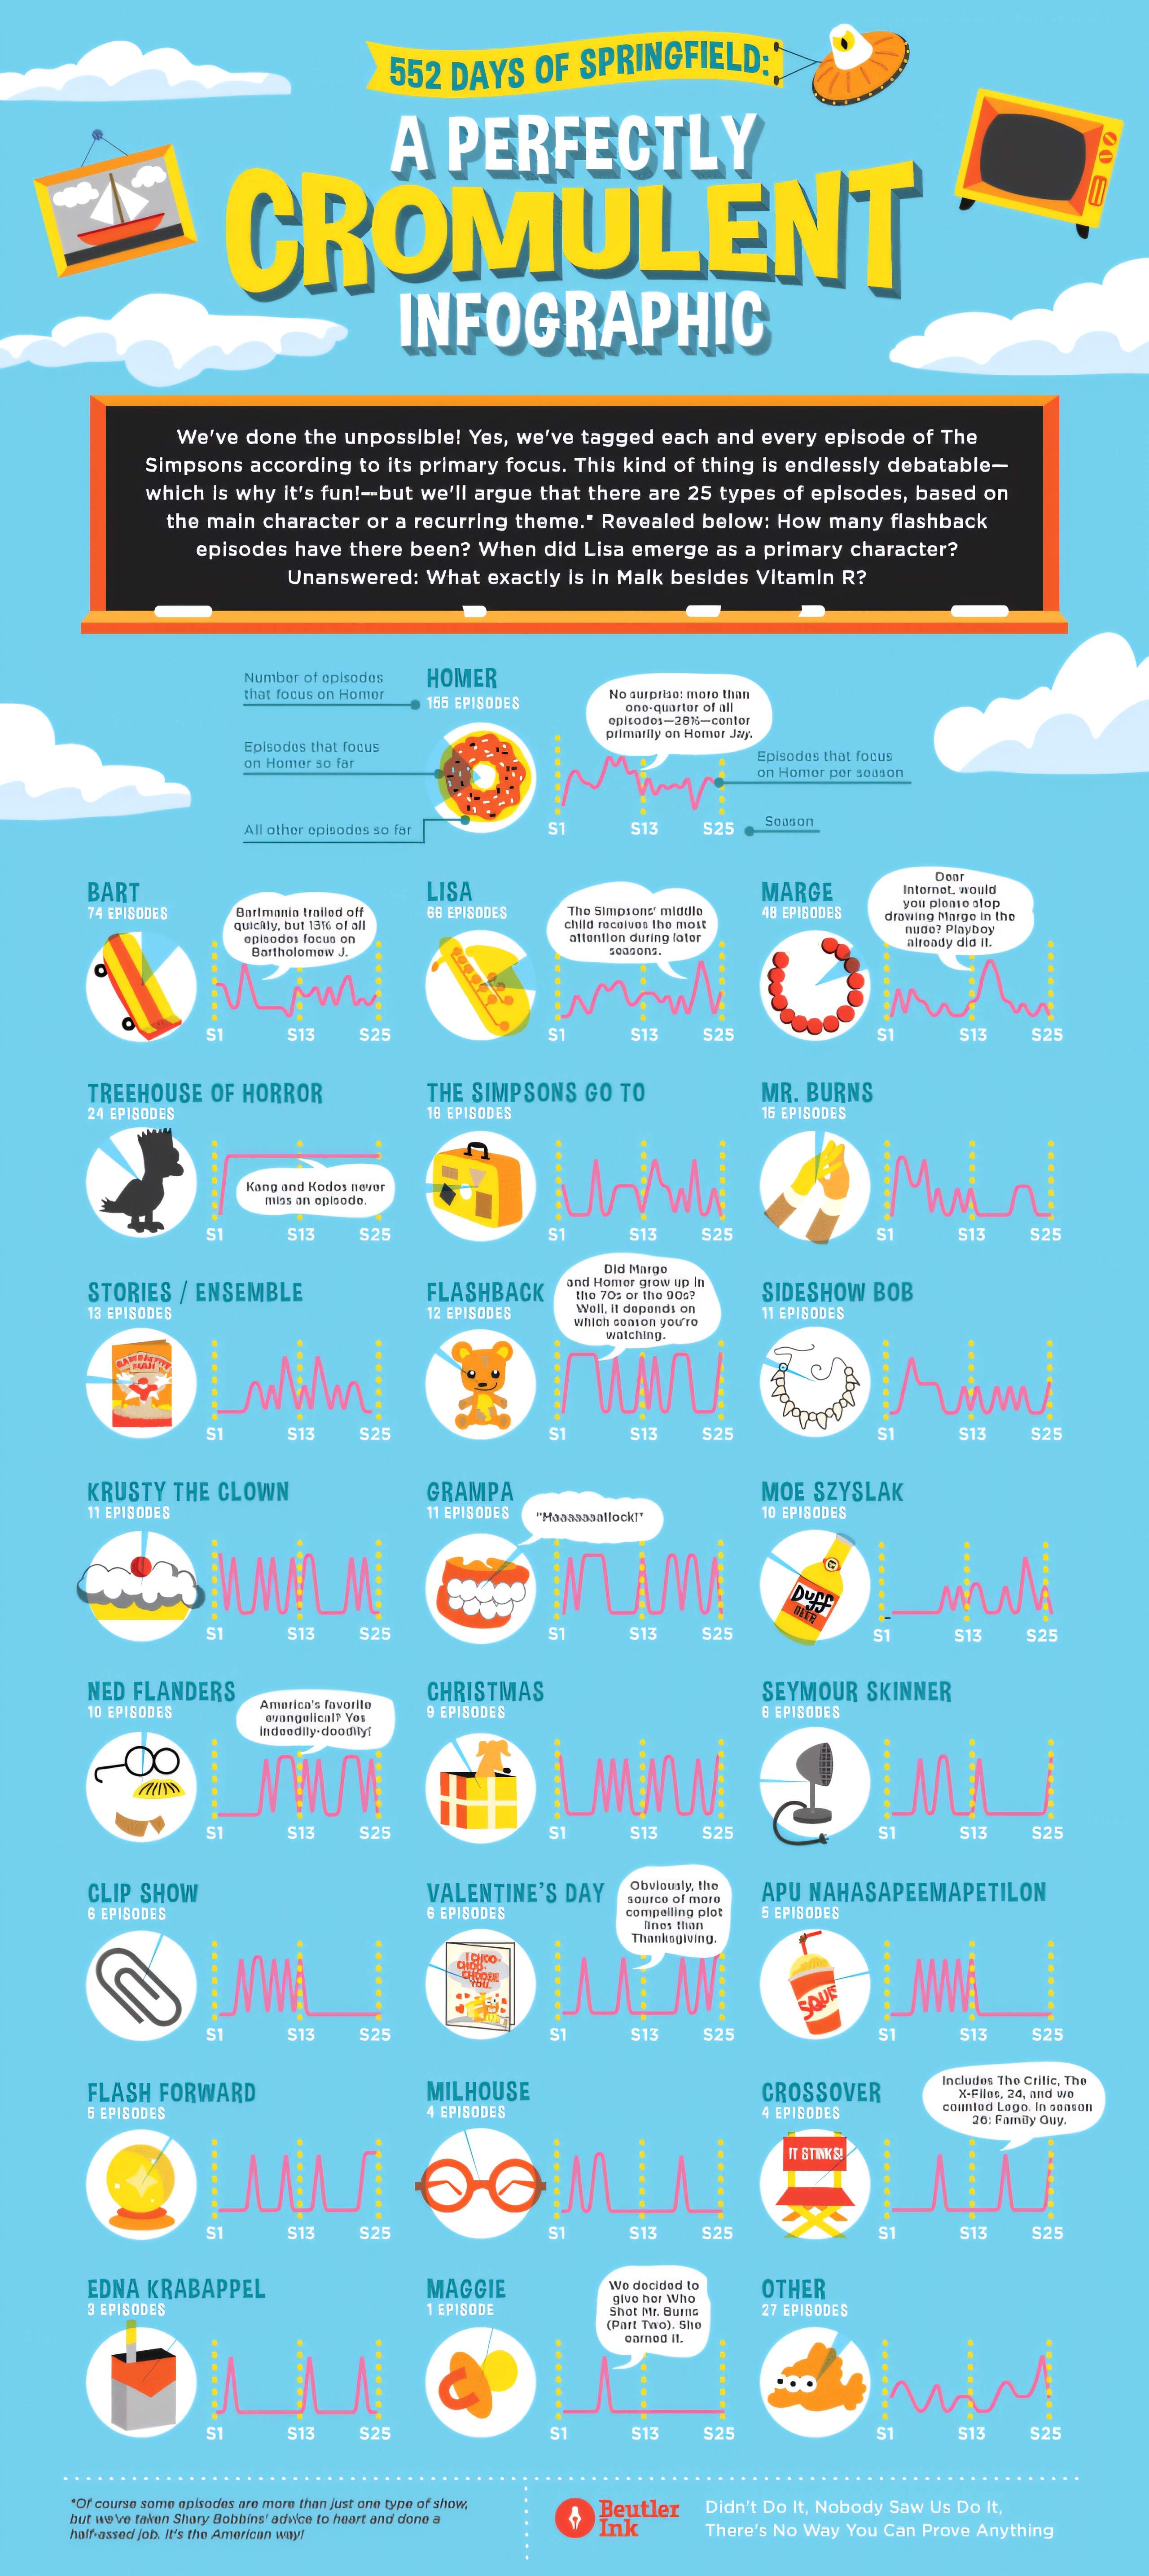
The graphic places character-led episodes alongside recurring themes. Its categories express the creator’s interpretation of which person or idea drives a story, so a viewer could reasonably debate individual classifications. That makes the chart a useful starting point for comparing episodes as well as an invitation to revisit them.
Within this classification, Homer’s 165 episodes exceed Bart’s 74 by more than two to one. Lisa’s 66 and Marge’s 48 show how differently the chart distributes narrative attention among the family. The full set of 25 categories adds themes beyond these four character groups. Explore the accompanying Simpsons episode and character guide to follow those patterns through the wider chart.
Simpsons viewership and show statistics: reading Springfield through data
Audience figures are only one way to study a television series. Dialogue, character interactions, locations and language patterns can reveal other aspects of how the show works. This Simpsons data visualization brings several of those measures together, drawing on an analysis described as using 600 episode scripts from Kaggle alongside historical audience information.
It is a different kind of visual guide from the cast illustration or the anniversary poster. Here, the questions concern patterns in a defined dataset: how audience sizes are distributed, how dialogue is shared, which characters interact, and what can be learned from the words and settings recorded in the source material.

Viewership, episode ratings and dialogue counts measure different things
The audience chart at the top is a histogram: it groups episodes by their number of viewers. Its bars show how frequently different audience sizes occur in the sample. They do not place the episodes in chronological order, so the chart alone cannot establish when viewership increased or declined.
There is another useful distinction between Simpsons viewership and episode review scores. Audience figures concern how many people watched under a particular measurement system. A viewer rating on a review site concerns how participating users scored an episode. An acclaimed episode and a widely watched broadcast are not automatically the same thing.
The dialogue panel labels Homer with approximately 29,000 lines in the analyzed material, offering a different perspective on his prominence from the story-focus chart. A line count measures recorded speech; it does not tell us how many episodes are primarily about him. The interaction, sentiment and location panels broaden the picture further, connecting character voices with the conversations and settings that make up Springfield.
Read this show-data infographic alongside 552 Days of Springfield to compare two views of the same fictional world: how stories are classified and how scripts are measured. Their samples differ, but the contrast gives a fan more to explore than either set of numbers on its own.
The Simpsons travel map: countries visited and adventures beyond Springfield
Springfield is the family’s home base, but travel episodes move familiar personalities into unfamiliar surroundings. A Simpsons world map makes that change of setting visible, connecting destinations with the episodes that take characters abroad. It turns a scattered set of holiday stories, exchanges and unexpected journeys into a geographical reference.
The travel infographic pairs places with episode titles and season information, making it useful when you remember a destination but cannot place the story. France, Japan, Australia, Italy and other locations become entry points into the episode archive, with the map providing a visual route between them.

| Destination | Episode |
|---|---|
| France | “The Crepes of Wrath” |
| London, United Kingdom | “The Regina Monologues” |
| Italy | “The Italian Bob” |
| Iceland | “The Saga of Carl” |
| Scotland | “Monty Can’t Buy Me Love” |
| Japan | “Thirty Minutes Over Tokyo” |
| Australia | “Bart vs. Australia” |
The episode references matter as much as the pins on the map. They help distinguish a journey made by one character from a trip involving the whole family, and a main setting from a passing reference. That is why two lists of countries the Simpsons have visited can differ even when both draw on the same series.
For a travel-themed rewatch, pick a destination, find its episode, then compare what changes when the story leaves Springfield. The Simpsons travel and countries guide is the companion resource for exploring the map in more detail.
Questions about The Simpsons characters, cast and statistics
Who are the main actors behind The Simpsons character voices?
The cast infographic profiles six central performers: Dan Castellaneta, Julie Kavner, Nancy Cartwright, Yeardley Smith, Hank Azaria and Harry Shearer. Familiar family pairings include Castellaneta as Homer, Kavner as Marge, Cartwright as Bart and Smith as Lisa. Several performers also voice recurring Springfield characters. The graphic is a historical cast illustration, rather than an exhaustive current credits list.
How many jobs has Homer Simpson had?
There is no single count that stays reliable without a date and counting rule. A list may include recurring work, temporary roles, businesses or very brief assignments, and later episodes can add more. Homer’s nuclear plant job is his familiar anchor, while the jobs and résumé guide explores a wider selection of his fictional career.
Why does The Simpsons’ history sometimes begin in 1987 instead of 1989?
The Simpsons first appeared as animated shorts on The Tracey Ullman Show in 1987. The full-length television series followed, with its first episode premiering on December 17, 1989. One date marks the characters’ television debut, while the other marks the series’ beginning. That distinction explains the anniversary infographic’s 1987 to 2017 frame.
Does the character infographic count every Simpsons appearance?
No. 552 Days of Springfield classifies a sample of 552 episodes by their main character or theme. It explores story focus across Seasons 1 to 25. A supporting character can appear in a story without becoming its subject, so the chart’s categories should not be read as total appearances, screen time or dialogue counts.
Does the viewership infographic show Simpsons ratings declining over time?
The audience histogram does not establish a time trend. It groups sampled episodes into audience-size ranges, rather than showing their chronological sequence. A dated season-by-season or episode-by-episode series would be needed to examine change over time. The infographic also contains separate visualizations of dialogue, interactions and other historical show statistics.
Does the Simpsons travel map show every country the family has visited?
It shows the destinations selected for the published graphic, including historical episode references. It is not a continuously updated country checklist. Destination counts can also depend on whether a guide includes individual characters’ journeys, full-family trips, imagined travel or brief references. Use the map’s episode labels to understand what each entry represents.